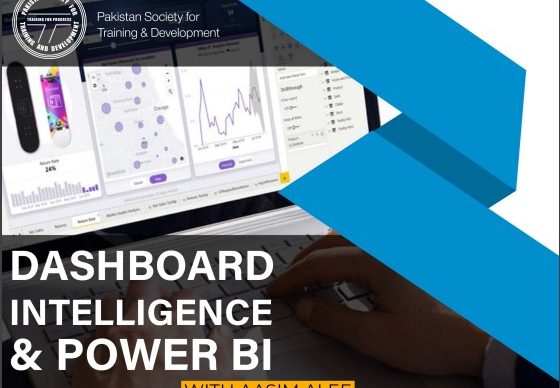
Dashboard Intelligence & Power BI

Course Features
Course Details
Introduction:
Are you in need for making sense of tons of Data? Are you interested in analyzing your corporate data in more professional way? Access to business intelligence (BI) has become a priority for many companies. Business Intelligence Tools of Excel provide an expansive set of features that enables the user to extract information from complex data, create dynamic reports and presentations.
Learning outcomes:
In this training participants will be able to manage, connect excel with different data sources, compile huge data sets and create data model with Excel PowerPivot, create a visually appealing Power View sheet, and use Power Map to integrate the data with Bing Maps to create a video presentation. Using Power BI Designer to create eye-catching visualization and dashboards share with your colleagues and let them access these reports on browsers and mobile devices
Who should attend:
Data analysts, Business intelligence professionals and anyone who wants to keep up with the pace with marvelous development of Microsoft in Business Intelligence for modern corporate World.
Training Objective:
In this BI Training participants will learn a hands-on end to end process of importing ‘dirty’ data into Power BI and transforming this into a stunning interactive dashboard share in the cloud. All sample projects, have a relevant context, covering ‘real-life’ scenarios that require building KPIs to answers specific business questions. This training ensures that, going forward, your team has the best practice foundation to continue the process of getting the right data into the right hands.
5 Key Steps of Power BI Training
- ETL (Extraction, Transformation & Loading) process using POWER QUERY
Power Query is a revolutionary tool to help Excel and Power BI Professionals get easy access & perform transformation to the data they need to do their job. You will learn how to connect to data sources like databases, webpages, SharePoint, text files, Excel and even PDF files and learn to convert & clean any ‘dirty’ data to good data.
- Data Modeling
Data modeling is a required skill to get the most out of Power BI, Power Pivot for Excel, and Analysis Services. This course is aimed at users of Power BI Desktop or Power Pivot for Excel, and at Analysis Services developers who want to learn how to build the optimal data model for their reporting needs.
- Performing Calculations with DAX (Data Analysis eXpressions
DAX is the native language of Power BI & Power Pivot for Excel. This section of Training is aimed at users of Power BI & Power Pivot for Excel that want to learn and master the DAX language and to use all the features of DAX, providing the knowledge to write formulas for common and advanced business scenarios.
- Getting Command on Microsoft Power BI Desktop
Creating dashboards and reports using Power BI desktop, applying key features & customization. Getting insights using AI (Artificial intelligence) visuals, importing custom visuals and working with maps.
- Sharing & Collaboration (Cloud Deployment)
This section of training provides a fundamental & detail understanding of the collaboration using the Power BI services. You will learn row level security – creating and testing roles, sharing dashboards & reports, creating app workspaces & publishing apps, adding users & editing workspaces, installing, and configuring the data gateway, scheduling data refreshes.
Contents:
Day 1
Overview of Power BI
- Why Microsoft Power Bl
- Brief history of Power BI
Understanding ETL (Extraction, Transformation & Loading) Process using Power Query
- Query Editor Overview
- Importing Data from Excel, CSV & PDF
- Understanding Applied Steps
- Data Transformations Options
- Adding Custom & Conditional Columns
- cleaning data - A variety of transformation techniques and patterns to solve various datachallenges
- Understanding Tabular Form of Data
- Unpivot Query - Unpivoting Data to bad data into Tabular Form
- Merge Query - Merging datasets - single & multiple conditions
- Append Query - Appending Data to combine all tables, sheets & files
- Folder Query - Combining all Sheets & Files from a folder
- Creating Dashboards & Reports using Power BI Desktop
- Choosing visuals based on context
- How to use Native Power BI Charts
- Customizing charts components
- Style your Reports with Shapes, Text Boxes, and Images
- Controlling Filter vs Cross Highlighting Visuals
Introduction to working with AI (Artificial Intelligence) visuals
- Use the Q&A visual to ask anything about Data
- Use the Decomposition Tree visual to break down a measure
- Add a textual narrative to your reports to help provide additional information to the user using Smart Narrative
Day 2
- Report Functionality
- Types of Slicers and filters
- Cross highlighting and filtering
- Creating hierarchies to Drill-Down in Visuals
- Creating Drill-Through pages for in Dept analysis
- Adding drill-through buttons
Optimizing the Design
- Adding fields in Tool Tip to add further analysis in visuals
- Creating Tool Tip Page and adding in visuals
- Power BI Bookmarking
- Customizing Bookmarks & present your reports in different sections
DATA MODELING
- Modeling Basics
- Modeling and Relationships
- Understanding types of relationships
- Data Normalization – Data Denormalization
- Denormalized vs Normalized Data Model
- Fact Table vs Dimension Tables
- Star Schema vs Snowflake Schema
- Understanding chain of relationships
- Understanding Date Table & It’s Importance
- Understanding helper columns, helper tables, & helper relationships
- Adding Measure table
Manipulating and Analyzing Data with the Data Analysis eXpressions (DAX) Language
- Introduction to DAX language
- What are Row context & Filter context?
- Understanding calculated columns and calculated fields
- Providing context for calculated fields within value area of visualizations
- Determining between implicit and explicit calculated fields
Day 3
Implementing DAX functions in Power BI
- Expressing information with Quick Measures
- Troubleshooting and debugging DAX calculations
Exploiting data analytics with aggregation
- Summarizing and aggregating data from other tables with the “X” functions
- Merging Tables using RELATED() and RELATEDTABLE() Functions
- Understanding CALCULATE & CALCULATETABLE Functions
Mining for information with date and time analysis
- Comparing and categorizing time periods with Time Intelligence functions
- Common calendar calculation
- YTD, QTD, MTD
- Growth over Year, Quarter, Month & Day
- Growth in percentage & Growth in number
- Last year YTD, QTD, MTD
- Using DAX Conditional & information functions
- Using IF function to handle multiple conditions
- Assigning Variable to values and functions to avoid repetitions in DAX Code
Governance & Distribution – Cloud Deployment
Publishing to Power BI Service
- Looking at the different Power BI licenses
- Publish your Report to PowerBI.com
- Creating Dashboards online
- Using Quick Insights
Apps & Groups (Workspaces)
- Benefits of using Apps and Groups (Workspaces)
- Creating workspaces and assigning roles to restrict access to dashboards
- Creating Organization Apps
Data Refresh
- Manually refreshing data
- Installing and using Personal Gateway
- Creating a Scheduled Refresh
Using Power BI on Mobile Devices
- Understanding the mobile client
- Understanding mobile layout
- Sharing dashboards & reports using mobile app
Date:16th, 17th, 18th February 2022
Mode: classroom
Time: 9:00 am to 5:00 pm
Training Fees: PKR 46,000/- + GST/-
For Further Details
Email: bushra.umais@wordpress-764963-3017117.cloudwaysapps.com / uzair.tariq@wordpress-764963-3017117.cloudwaysapps.com
Number: 0333-2406753 / 021-35857484/ 03319763144
Click here to Download Flyer
Payment Details:
The cheque will be made under the name of “Pakistan Society for Training and Development” and dispatch it to following address;
Pakistan Society for Training and Development
Plot # TC-3, 34th Street, Khayaban-e-Seher
Phase V, DHA, Karachi 75500.
Cancellation Policy:
PSTD Cancellation Policy – Cancellations made at least 5 working days prior to the program will be refunded 50%. If a booking is canceled in less than 5 working days, no refunds can be given. Cancellations must be confirmed by a letter or email. Substitutions may be made at any time for the same program only. In case of the participant not showing up on the day of the training a replacement can be sent.


