
Advance Excel for advance Data Analysis and Reporting
Course Features
Course Details
Introduction:
Data is the bloodline of any organization. Data helps companies predict trends, identify opportunities and stay ahead of their competition, Data describes various organizational aspects such as productivity and performance. It provides the basis for the analysis of various Key performance indicators and helps management to make informed decisions.
Microsoft Excel is an amazing tool that transform data into meaningful information for the management for better analysis and decision making. Excel has all the needed functions and the features required for the analysis, and presentations of the data.
In this workshop, we will learn how to use Microsoft Excel as a Data Analysis and Reporting tool. We will create reports and dashboard with the help of Excel functions and features.
Learning Objectives
After the Completion of this workshop, participants will be able to:
- Use Excel’s vital functions used in industry.
- Use Pivot Tables to summarize and organize data for dashboards.
- Use Excel BI Tools
- Organize data for getting various insights
- To present data graphically to understand data more.
- Create different Reports.
- Create Dashboards
- use various form controls such as (check box, combo box, Scroll bar, List box)
Workshop Contents
Vital Functions used in all organizations/ Excel Essence
- Logical functions (if, and, or, not, iferror)
- Lookup and reference functions (vlookup, index, match, choose)
- Summation functions (sum, sumif, sumifs)
- Statistical function (average, averageif, averageifs, count, countif, countifs)
- Text functions (left, right, mid, len, find, lower, upper, proper, concatenate)
Data Organization
- Sorting data by multiple columns at the same time.
- Applying a pre-installed custom sort.
- Creating a customized list and performing a custom sort.
- Data re-organization using colours and criteria
- Using auto Filter.
- Advanced filter criteria.
- Sub-totalling.
- Removing subtotals.
- Expanding and collapsing outline detail levels.
Data visualizations Data understanding and communication
- Why Charts?
- Data requirements for charts
- Creating a chart.
- Adding a secondary axis to a chart.
- Formatting Charts
- Setting scales of Charts.
- Inserting images into chart columns.
- Inserting images to chart bars.
- Sparkline in cell
Data presentations and analysis by Pivot Tables
- Using the Pivot Table Wizard
- Changing the pivot table layout
- Formatting
- Grouping items
- Inserting calculated fields
- Pivot Table Options
- Display and hide data in fields.
- Lay out reports directly on worksheet.
- Pivot Chart
- Dynamic reporting
- Slicers for presentation and analysis
- Presenting Pivot Table based on various calculations.
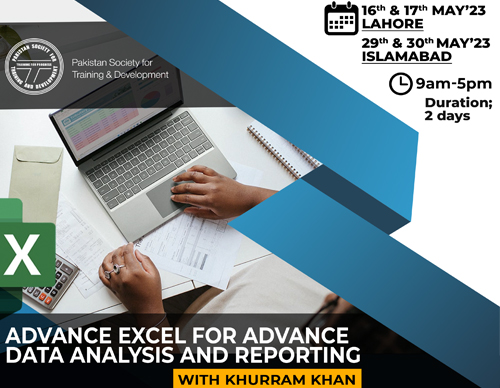
Training name: Advance Excel for Advance Report Development
Training time: 9AM to 5PM
Training Date: 16th & 17th MAY, 2023 Lahore
Training Date: 29th & 30th MAY, 2023 Islamabad
Training Investment: PKR 35,500/+ST (Non Member) | PKR 33,500/+ST (Member)
Training Location: PSTD
Trainer Name: Khurram Khan
For Further Details
Email: Mehtab.hafeez@pstd.com.pk / Mehnaz.majeed@pstd.com.pk
Number: 0318-4387944 | 0332-2297827
Click here to Download Flyer
Payment Details:
The cheque will be made under the name of “Pakistan Society for Training and Development” and dispatch it to following address;
Pakistan Society for Training and Development
Plot # TC-3, 34th Street, Khayaban-e-Seher
Phase V, DHA, Karachi 75500.
Cancellation Policy:
PSTD Cancellation Policy – Cancellations made at least 5 working days prior to the program will be refunded 50%. If a booking is canceled in less than 5 working days, no refunds can be given. Cancellations must be confirmed by a letter or email. Substitutions may be made at any time for the same program only. In case of the participant not showing up on the day of the training a replacement can be sent.
